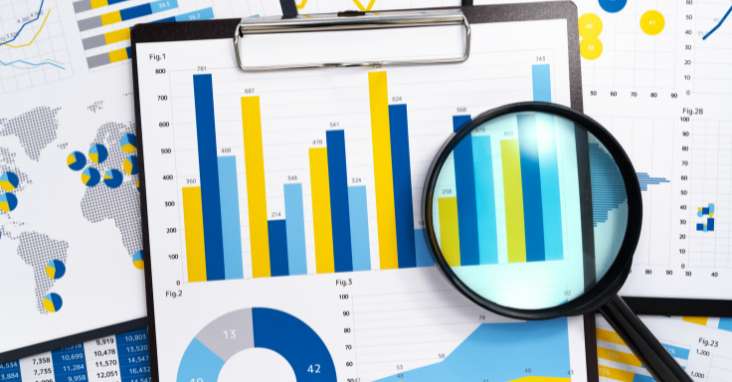
In today’s fast-paced business world, efficient data analysis and reporting systems are critical to the success of any organization. Reporting software is a tool that allows businesses to automate data collection and analysis, produce timely and accurate reports, and make informed decisions based on the insights gained from the data. In this blog post, we’ll explore the definition, benefits, key features, potential problems, costs, and top software providers of reporting software. We’ll also provide use case examples and frequently asked questions to help you better understand the importance and utility of reporting software.
What is reporting software?
Reporting software is a computer program that automates the process of collecting, analyzing, and presenting data. The software is designed to streamline data analysis and reporting by consolidating data from various sources, cleaning and processing the data, and generating data visualizations, and reports that provide insights into the performance of a business. Reporting software can be customized to meet the unique needs of different businesses, allowing them to track key performance indicators (KPIs), monitor business processes, do corporate performance management and make data-driven decisions.

Benefits of reporting software
Reporting software offers a range of benefits to businesses of all sizes and industries. Here are some of the main benefits:
Time Savings
One of the most significant benefits of reporting software is the time savings it offers. By automating data collection and analysis, reporting software eliminates the need for manual data entry and processing, freeing up time for employees to focus on more important tasks. For example, instead of spending hours compiling data from various data sources, and manually creating reports, employees can use reporting software to generate reports in a matter of minutes.
Accuracy
Reporting software reduces the risk of human error by automating data processing and analysis of automated reports. The software can identify inconsistencies and errors in the data, ensuring that reports are accurate and reliable. This is especially important in industries where even small errors can have significant consequences, such as healthcare, finance, and manufacturing.
Real-time Reporting
Reporting software allows businesses to have business intelligence tool generate real-time reports, providing up-to-date insights into business performance. This allows businesses to respond quickly to changes in the market or industry, identify trends and opportunities, and make informed decisions based on current data.
Data Visualization
Reporting software offers a range of data visualization tools, such as charts, graphs marketing reports, and interactive dashboards., that allow businesses to easily understand and interpret complex data. This makes it easier for businesses to identify patterns, trends, and insights that can inform decision-making.
Customization
Reporting software can be customized to meet the specific needs of different businesses. This means that businesses can track the KPIs that are most relevant to them, monitor business processes, see marketing data and generate custom reports, that are tailored to their unique needs.

Key Reporing Software Features
Reporting software offers a range of features designed to streamline data analysis and reporting. Here are some of the key features:
Data Integration
Reporting software can integrate data from various sources, such as databases, spreadsheets interactive reports google analytics, and APIs, allowing businesses to consolidate data into a single source of truth. This makes it easier to analyze and report on data, as well as identify trends and insights.
Data Analysis
Reporting software offers a range of data analysis tools, such as statistical analysis, predictive analytics, and data mining, that allow businesses to identify patterns and trends in their data. This can help businesses make informed decisions based on current data.
Reporting
Reporting software offers a range of types of reporting tools now, such as dashboards, charts, and graphs, that allow businesses to visualize their data in meaningful ways. This makes it easier for businesses to understand and interpret their data, as well as communicate insights to stakeholders.
Collaboration
Reporting software allows businesses to collaborate on data analysis and reporting, enabling multiple users to work on the same data set and share insights and create customized reports, together. This can help improve communication and decision-making across teams and departments.
Security
Reporting software offers robust security features, such as role-based access control, data encryption, and user authentication, that help protect sensitive business data from unauthorized access and breaches.
Customization
Reporting software can be customized to meet the unique needs of different businesses, allowing them to track the KPIs that are most relevant to their industry and business objectives. This makes it easier to monitor performance and make informed decisions based on data.

Reporting Software Use Case Examples
Reporting software can benefit businesses across a range of industries and sizes. Here are five use case examples:
Healthcare
Reporting software can be used in healthcare to monitor patient outcomes, track healthcare expenses, and identify trends in healthcare delivery. Healthcare providers can use reporting software to track patient outcomes, such as readmission rates, infection rates, and patient satisfaction, and make data-driven decisions to improve patient care.
Retail
Reporting software can be used in retail to monitor sales performance, track inventory levels, and identify trends in customer behavior. Retailers can use reporting software to track sales by product, store, and region, monitor inventory levels to avoid stockouts, and identify opportunities to improve customer engagement and loyalty.
Finance
Reporting software can be used in finance to monitor financial performance, track expenses, and identify opportunities to improve profitability. Finance teams can use reporting software to track key financial metrics, such as revenue, expenses, and profit margins, and make data-driven decisions to improve financial performance.
Manufacturing
Reporting software can be used in manufacturing to monitor production performance, track inventory levels, and identify opportunities to improve efficiency. Manufacturers can use reporting software to track production output, monitor equipment utilization, and identify opportunities to reduce waste and improve quality.
Education
Reporting software can be used in education to monitor student performance, track attendance, and identify trends in academic achievement. Educators can use reporting software to track student progress, monitor attendance, and identify opportunities to improve academic performance and student engagement.

Potential Reporting Software Problems
While reporting software offers many benefits, there are also potential problems to consider. Here are some of the main issues to be aware of:
Data Quality
Reporting software relies on accurate and reliable data. If the data is incomplete, inconsistent, or outdated, the reports generated by the software may be inaccurate or misleading. It’s important to ensure that the data used by the software is of high quality and regularly updated.
User Adoption
Reporting software is only effective if it’s used consistently by employees. If employees are resistant to using the software or don’t fully understand how to use it, the benefits of the software may not be realized. It’s important to provide training and support to employees to ensure that they are comfortable using the software.
Cost
Reporting software can be expensive, especially for smaller businesses. It’s important to consider the costs associated with licensing, training, and ongoing support when evaluating reporting software.
Integration
Reporting software may require integration with other software and systems used by the business. This can be complex and time-consuming, requiring the assistance of IT professionals.
Security
Reporting software may store sensitive data, such as financial information and customer data. It’s important to ensure that the automated reporting software has robust security features in place to protect this data from unauthorized access and breaches.
Costs
The costs associated with reporting software can vary widely depending on the features and functionality offered by the various marketing reporting software. Some software providers offer subscription-based pricing models, while others charge a one-time fee for the software. In addition to the software costs, businesses should also consider the costs associated with training and support, as well as any IT costs associated with integration.

How We Chose the Best Reporting Software
To evaluate reporting software, we conducted research on a range of software providers and analyzed reviews on popular software review websites, including Serchen, G2, and Trustpilot. We evaluated software based on a range of factors, including features, ease of use, customization options, customer support, and pricing.
Top 5 Software Providers
Here are five of the top reporting tool and software providers, along with a brief history, pros and cons, and best fit customers for each reporting tool used:
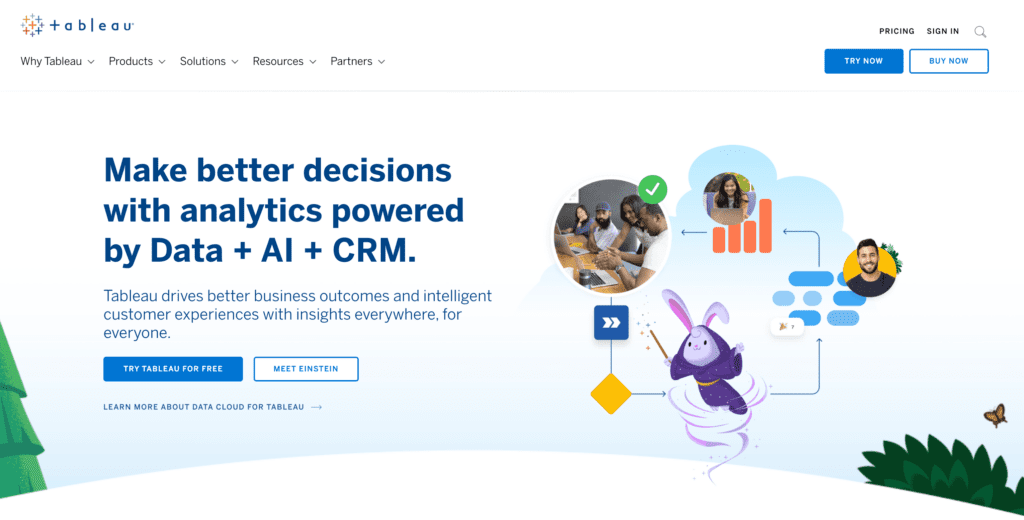
Tableau
Tableau was founded in 2003 and has since become a leading provider of business intelligence and reporting software. Tableau offers a range of reporting tools, including its data visualization software, data analysis, and reporting, that allow businesses to track and analyze their data in real-time.
Pros:
Easy-to-use drag-and-drop interface
Robust data visualization tools
Wide range of customization options
Large user community for support and collaboration
Cons:
Expensive pricing
Limited data manipulation options
Steep learning curve for advanced features
Best fit customers:
Large enterprises with complex data needs
Businesses in data-intensive industries, such as finance, healthcare, and technology
Microsoft Power BI
Microsoft Power BI is a cloud-based reporting and analytics tool that allows businesses to visualize and analyze their data in real-time. Power BI integrates seamlessly with other Microsoft products, such as Excel and SharePoint, and offers a range of data visualization and reporting tools.
Pros:
Easy-to-use interface with familiar Microsoft styling
Affordable pricing options
Robust data visualization and reporting tools
Integrates with other Microsoft products
Cons:
Limited customization options for charts and graphs
Limited data analysis tools compared to other software providers
Limited data manipulation options
Best fit customers:
Small and mid-sized businesses
Businesses that use other Microsoft products, such as Excel and SharePoint
SAP Crystal Reports
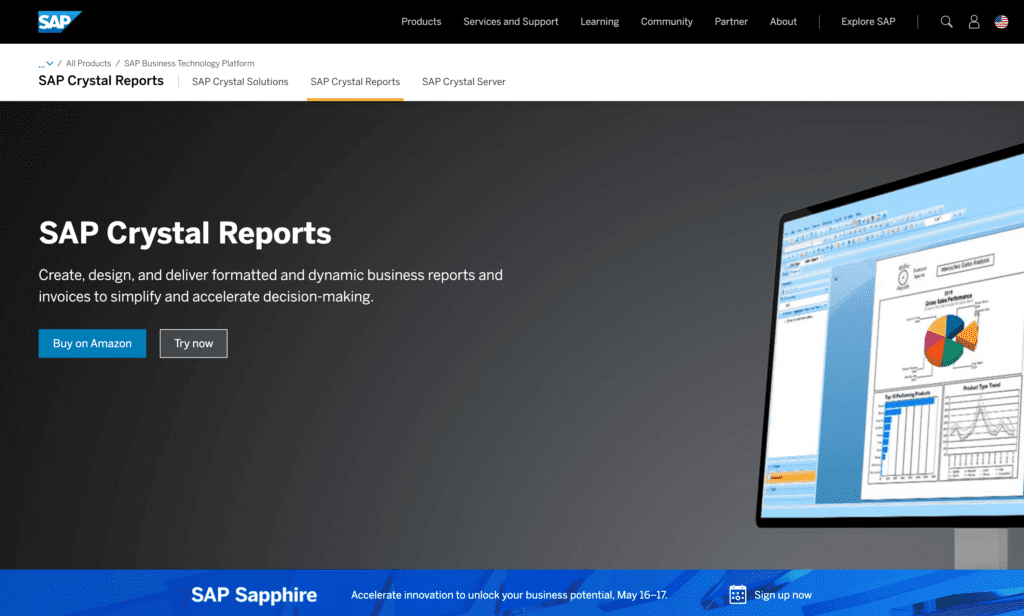
SAP Crystal Reports is a reporting software tool that allows businesses to create, design, and deliver reports in a range of formats. SAP Crystal Reports offers a range of reporting tools, including data visualization, data analysis, and other reporting tools.
Pros:
Wide range of reporting options and formats
Customizable templates and styles
Integrates with other SAP products
Affordable pricing options
Cons:
Steep learning curve for advanced features
Limited data analysis options compared to other software providers
Limited data manipulation options
Best fit customers:
Businesses that use other SAP products
Businesses that require a range of reporting formats and options
Domo
Domo is a cloud-based, reporting solution, and analytics tool that for business intelligence software allows businesses to track and analyze their data in real-time. Domo offers a range of reporting tools, including data visualization, data analysis, and reporting, that can be customized to meet the unique needs of different businesses.
Pros:
Easy-to-use interface
Robust data visualization and reporting tools
Customizable dashboards and alerts
Integrates with a range of third-party applications
Cons:
Expensive pricing options
Limited data manipulation options compared to other software providers
Steep learning curve for advanced features
Best fit customers:
Large enterprises with complex data needs
Businesses in data-intensive industries, such as finance, healthcare, and technology
Zoho Analytics
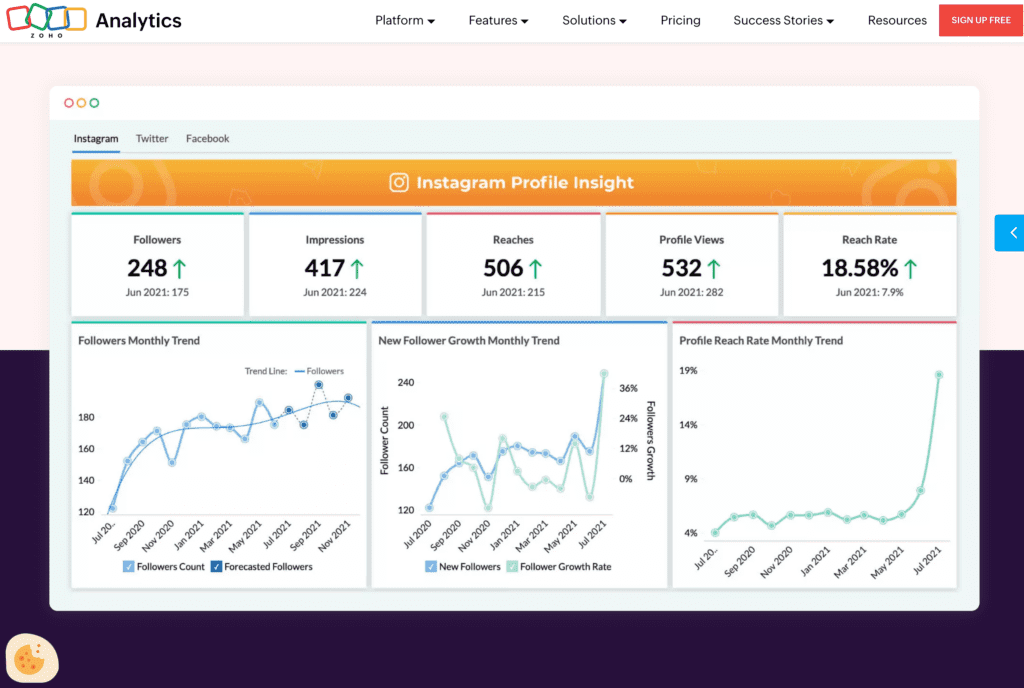
Zoho Analytics is a cloud-based reporting and analytics tool that allows businesses to track and analyze their data in real-time. Zoho Analytics offers a range of data reporting tools embedded analytics tools, including data visualization, data analysis, and reporting, that can be customized to meet the unique needs of different businesses.
Pros:
Affordable pricing options
Wide range of customization options
Integrates with a range of third-party applications
Robust data visualization and reporting tools
Cons:
Limited data manipulation options Limited data analysis options compared to other software providers
Steep learning curve for advanced features
Best fit customers:
Small and mid-sized businesses
Businesses that require a range of customization options

Reporting Software – FAQ
Here are some frequently asked questions related to reporting software:
What types of businesses can benefit from reporting tools?
Reporting software can benefit businesses of all sizes and industries, including healthcare, retail, finance, manufacturing, and education.
What are the benefits of a reporting tool?
The benefits of reporting software include time savings, accuracy, real-time reporting, data visualization, and customization.
How much does reporting software cost?
The cost of reporting software can vary widely depending on the features and functionality offered by the software. Some software providers offer subscription-based pricing models, while others charge a one-time fee for the software.
What are some potential problems with using reporting software?
Potential problems with using reporting data warehouse software include issues with data quality, user adoption, cost, integration, and security.
How can businesses ensure that they are using reporting software effectively?
To use reporting software effectively, businesses should ensure that their data is accurate and up-to-date, provide training and support best reporting tools to employees, and regularly review and analyze data in their reports to identify trends and insights.
What are some key features of reporting software?
Key features of reporting software include data integration, data analysis, reporting, collaboration, and data security, and customization.
What are some of the best reporting tools?
Some popular reporting software providers include Tableau, Microsoft Power BI, SAP Crystal Reports, Domo, and Zoho Analytics.
How can businesses choose the best reporting software for their needs?
To choose the best reporting software for their needs, businesses should evaluate software based on factors such as features, ease of use, customization options, customer support, and pricing.
What are some common reporting formats?
Common reporting formats include charts, graphs, reports and dashboards export reports,, tables, and PDF reports.
Can reporting software integrate with other software and systems?
Yes, reporting software can integrate with other software and systems used by businesses, allowing them to be business users to consolidate multiple data sources into a single source of truth and streamline data analysis and reporting.
Conclusion
Reporting software is a valuable tool for businesses looking to streamline data analysis and reporting. The benefits of reporting software include time savings, accuracy, real-time reporting, data visualization, and customization. However, businesses should also be aware of potential problems with using reporting software, such as issues with data quality, user adoption, cost, integration, and security. By evaluating reporting software based on factors such as features, ease of use, customization options, customer support, and pricing, businesses can choose the best software for their needs and improve their data analysis and reporting processes.

